Can Machine Learning Be Used to Predict Patients’ Hospital Reentry Rates?
Guest Contributor: Elizabeth Zimmerman, University of Washington, Seattle, WA, USA
How Good Is Machine Learning in Predicting All-Cause
30-Day Hospital Readmission? Evidence From Administrative Data
Li Q, Yao X, Échevin D
Value Health. 2020;23(10):1307–1315
doi.org/10.1016/j.jval.2020.06.009
Hospital readmissions account for a significant part of overall inpatient expenditures and have considerable clinical and economic effects on patients and society. In addition, there are ongoing connections between hospital readmission rates and patients’ ages, comorbidities, diagnostics, and lengths of stay. Thus, readmission is a difficulty that all hospital systems need to address. Understanding these outcomes, such as readmission rates, requires data availability, explanatory variables, and observations. Data are gathered through administrative and electronic medical records, as well as several other significant data sources. Machine-learning algorithms can be used to detect complicated patterns and interactions in data when there are unknown and sophisticated risk factor correlation patterns. While identifying individuals at risk of readmission is only the first step toward reducing rehospitalization, machine learning can improve predictability.
There are various ways to analyze data, whether using traditional statistical methods or more recent machine learning algorithms. The paper by Li et al highlighted the novel approach of analysis using machine learning algorithms. The purpose of analysis can be prediction as opposed to uncovering clinically meaningful explanatory variables. In this instance, the authors explored machine learning’s predictive capacity and effectiveness using Canadian hospitalization records. The specific objective focused on predicting 30-day readmission using the algorithms while comparing the results to traditional approaches.
Using administrative data from 1,631,611 patient visits from 1995-2012 in Quebec, the likelihood of rehospitalization and discharge was estimated. The methods behind the study included records of hospital stays based on prior admission diagnoses (MED-ECHO) and billed medical services and physician compensation (RAMQ). The performance of statistical methods including Naive Bayes, traditional logistic regression, and logistic regression with penalization (ie, methods that discourage the model from having extremely unrealistic values) was used to predict patient reentry. This was compared to the machine learning methods such as random forest, deep learning, and extreme gradient boosting. The authors split the data set into 2 sections to train the machine learning algorithm: training data and testing data. The split-sample method allowed the testing of multiple algorithms while avoiding over-fitting. The machine learning process was undertaken by the algorithms using a training dataset (which contained 80% of the data) over 10-fold validation attempts. Finally, the trained model calculated the study results using a separate hold-out dataset (20% of the data).
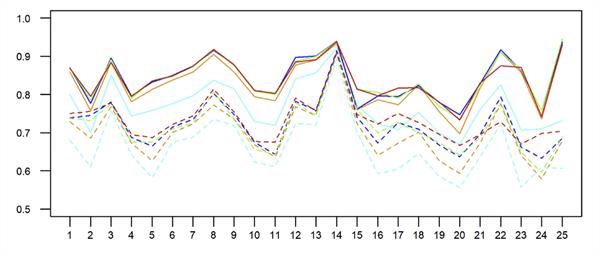
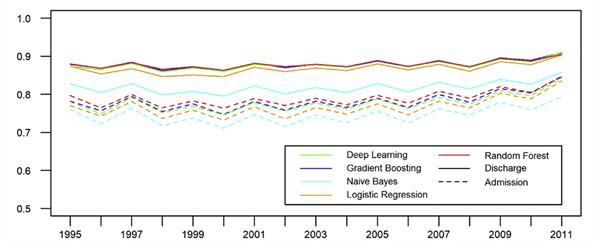
To compare the results of the approaches, the primary measure used was the area under the receiver operating characteristic curve (AUC). The AUC is a commonly used prediction metric to assess discriminative ability. An AUC of 0.5 implies that the model performs no better than chance; an AUC of 0.7 to 0.8 shows that the model has modest to adequate discriminative capacity, and an AUC greater than 0.8 shows that the model has high discriminative performance. Study results showed the AUC was over 0.79 at admission and greater than 0.88 at discharge. For example, deep learning achieved 0.7898, and logistic regression with penalization achieved 0.7759. However, Naive Bayes performed significantly worse. At hospital discharge, extreme gradient boosting was the most predictive algorithm; random forest and deep learning also achieved better than 0.88 in AUC; and logistic regression with penalization reaching greater than 0.87 in AUC. The Figure depicts AUC variation across key diagnostic categories and the pattern of variation is similar among algorithms. Logistic regression with penalization produced comparable results; however, standard logistic regression failed without penalization. The importance of explanatory variables fluctuates depending on the algorithm and calibration curves that ensured the data’s precision. In general, the Naive Bayes method is the quickest in machine learning. Furthermore, it was discovered that logistic regression with penalization had a comparable processing speed. The authors noticed that when they evaluated the 3 empirical approaches, extreme gradient boosting required substantially less time than the other 2. Outcomes further explain that the diagnostic codes, which divide into multiple subcategories, are highly predictive markers.
Figure. (A) Area under the receiver operating characteristic curve by major diagnostic category.

(B) Area under the receiver operating characteristic curve by discharge year.

According to the authors’ research, predictions may be beneficial when machine learning is used, and findings indicate that it may be capable of predicting 30-day readmissions. This study could be an exciting read for those looking to learn more about utilizing machine learning to forecast readmissions and reduce rehospitalization. The extra costs that each additional readmission to the hospital brings for any countries or payers’ healthcare system could be further reduced. Attempts to anticipate this critical cost driver of reentry rates have shown modest to moderate results in the past. With further investigation, the findings and forecasts presented here show that machine learning could, in the future, be used to aid decision making by identifying the risk factors of readmissions putting the patient’s well-being front and center.

