Demystifying ICER’s Equal Value of Life Years Gained Metric
Ken O’Day, PhD, MPA; Dylan J. Mezzio, PharmD, MS, Xcenda, Palm Harbor, FL, USA
In December 2018, the Institute for Clinical and Economic Review (ICER) introduced the equal value of life years gained (evLYG) metric and has since incorporated it in its 2020-2023 Value Assessment Framework to be a component of all their new health technology assessments (HTAs).1,2 This article seeks to shed light on ICER’s evLYG metric: why it was developed, what it represents, how it is calculated, and its impact on ICER assessments.
Why the evLYG?
The quality-adjusted life year (QALY), which incorporates the potential of treatments to both improve quality of life and extend life, has been the preferred metric for many HTA agencies worldwide. Since it began drug evaluations in 2014, ICER has utilized the QALY as its primary outcome measure, following the United Kingdom’s National Institute for Health and Care Excellence.
However, in the United States, the QALY has been viewed historically with suspicion by healthcare payers, patients, and advocacy groups. These stakeholders have presented both methodological and ethical arguments against the use of QALYs. These arguments call out the inherent subjectivity of quality-of-life estimates and thresholds and raise concerns about the potential to limit patient access to treatments. In addition, concerns have been raised that the QALY discriminates against the elderly, disabled, and terminally ill by assigning a lower value to their lives than others. According to the National Council on Disability, “QALYs are built on a faulty premise that life with a disability is inherently worse than lives without a disability.”3 This was the basis for banning the use of QALYs by Medicare in the Affordable Care Act.4 While ICER defended the use of QALYs in their evaluations, they also developed the evLYG metric as a supplement to the QALY in response.1
What Is the evLYG?
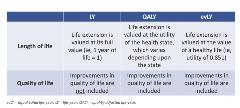
The evLYG values all gains in life years at the full value of a healthy life year, such that regardless of age, disability, or illness, all life year gains are valued equally. ICER utilizes a value of 0.851 for the value of a healthy life year based on the age- and gender-adjusted utility of the healthy US population.5 Arguably, the name ICER chose for this outcome is a misnomer, as it implies that there is no quality-adjusted component; however, that would be an incorrect assumption, as evLYs do include improvements in quality of life. A more descriptive term would have been
quality-adjusted equal value of life years. Figure 1 summarizes the key characteristics of life years (LYs), QALYs, and evLYs.
Figure 1. Summary of key characteristics of outcomes.
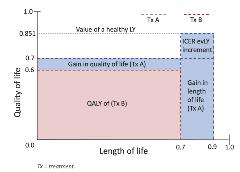
When ICER introduced the evLY, they did not provide a clear example or set of calculations for how to incorporate the evLY metric into cost-effectiveness analyses. Accordingly, Figure 2 attempts to illustrate the evLY concept and what it adds to the standard QALY outcome. The figure represents a single cycle in a cost-effectiveness analysis, where the x-axis represents life years (maximum value of 1, assuming a 1-year cycle) and the y-axis represents quality of life (maximum value of 1).
The evLY adds the increment above the gain in length of life (in the figure, this area is defined by [0.851-0.7] x [0.9-0.7] = 0.0302). This increment is calculated and added to each treatment with a life year gain relative to the comparator with the lowest life years (which becomes the reference). The evLYG is the difference between the entire blue-shaded area minus the red-shaded area in Figure 2.
Figure 2. Equal value life years.
How Is the evLY Calculated?
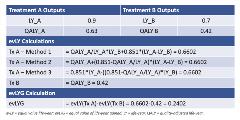
ICER provides a stepwise description of their method to calculate evLYs in Appendix E of their recent evidence reports. Unfortunately, the steps are not very clear. In particular, step 3 is confusingly worded and contains an error in which the average quality of life is described as LYs ÷ QALYs when it is correctly calculated as QALYs ÷ LYs. Additionally, the method that ICER describes is only one possible method for calculating evLYs. Figure 3 shows 3 possible methods to calculate the blue shaded area (evLYs) using 2 rectangular figures, which all yield the same result.
Figure 3. Methods for calculating evLYs.

Figure 4 shows the formulas for how to calculate these areas in a spreadsheet using each of the 3 methods that we developed. These formulas can be utilized to calculate evLYs for each cycle in a cost-effectiveness analysis.a The values are summed to obtain the cumulative values and discounting may be applied just as for LYs and QALYs.
Figure 4. Calculating evLYs.
Note that the evLY for the treatment with the lowest LYs will equal the QALYs for that treatment, with the exception where the LYs for a treatment are not consistently the lowest across all cycles and in microsimulations due to individual patient variation. evLYs will always be lower than LYs and generally higher than QALYs, with the exception where a treatment that extends life reduces quality of life by an amount that exceeds the evLY increment. Utilizing health state utilities greater than ICER’s 0.851 healthy utility value will result in the application of an evLY decrement; however, a higher value for a healthy life could be utilized.b
What Is the Impact of evLYG on ICER’s Assessments?
As of July 2020, ICER’s evLYG metric has been used as an outcome measure in 6 assessments (2 completed and 4 in process). ICER reports evLYs in addition to LYs, QALYs, and total costs in the disaggregated results. Incremental cost-effectiveness ratios for evLYs are also included, in addition to those for LYs and QALYs. Since evLYs result in larger values than QALYs for life-extending treatments and since the evLYs for comparators with lower LYs yield the same evLY values as QALYs, this results in larger incremental differences and consequently lower incremental cost-effectiveness ratios for evLYs than for QALYs. Figure 5 shows the impact of evLYs on these 6 assessments. Points at or near the origin reflect no essential difference between the 2 metrics. Points to the northeast represent higher evLYs and lower cost-effectiveness ratios. The degree that cost-effectiveness ratios improve (decrease) depends on the percent increase in QALYs and the relative QALY differences between the individual comparators.
Figure 5. evLYs in recent ICER assessments.
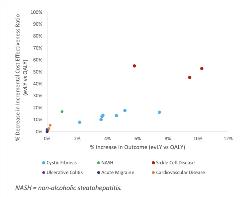
In 3 assessments (nonalcoholic steatohepatitis, cystic fibrosis, and sickle cell disease), evLYs were greater than QALYs, while in the other 3 assessments, there were virtually no differences in the outcomes. Despite reductions in the incremental cost-effectiveness ratios as large as 50% for sickle cell disease, these differences did not materially affect any assessments, as the QALY-based incremental cost-effectiveness ratios were sufficiently high, such that even the greatly reduced evLY incremental cost-effectiveness ratios were still well above the thresholds. Across all 6 assessments, the average increase from QALYs to evLYs was 2.2% (range: 0.0%–10.3%) and the average decrease in the evLY incremental cost-effectiveness ratios compared to the QALY incremental cost-effectiveness ratios was 11.0% (range: 0.0%–55.3%). Acute migraine yielded no difference, as treatments were assumed not to extend life.
In general, treatments with greater life extension and where the quality of life of surviving patients is low will see the greatest potential benefit from the evLY metric compared to the QALY metric. This would potentially include certain treatments for cancer (particularly those affecting younger patients) and gene therapies for debilitating, deadly diseases, while diseases where treatments only, or primarily, improve quality of life (eg, migraine, depression among cancer patients) will see minimal or no benefit. While it is still too early to tell what the full impact of evLYs will be on ICER’s assessments, it appears that the impact may be attenuated by limited life year gains and incremental cost-effectiveness ratios that are already well above (or potentially below) ICER’s thresholds. The real test case will be how ICER handles an assessment when the evLY makes a substantive difference compared to the QALY.
References
1. Institute for Clinical and Economic Review. The QALY: rewarding the care that most improves patients’ lives. December 2018. https://icer.org/wp-content/uploads/2020/12/QALY_evLYG_FINAL.pdf. Accessed January 20, 2021.
2. Institute for Clinical and Economic Review. 2020-2023 Value Assessment Framework. January 31, 2020. http://icerorg.wpengine.com/wp-content/uploads/2020/10/ICER_2020_2023_VAF_013120-4-2.pdf. Accessed January 20, 2021.
3. National Council on Disability. Quality-adjusted life years and the devaluation of life with disability: part of the bioethics and disability series. https://ncd.gov/sites/default/files/NCD_Quality_Adjusted_Life_Report_508.pdf. Accessed June 30, 2020.
4. Patient Protection and Affordable Care Act of 2010, Pub. L. No 111-148, § 124 STAT. 119. https://www.congress.gov/111/plaws/publ148/PLAW-111publ148.pdf. Accessed July 14, 2020.
5. Pickard AS, Law EH, Jiang R, et al. United States valuation of EQ-5D-5L health states using an international protocol. Value Health. 2019;22(8):931-941.
Explore Related HEOR by Topic

