Socioeconomic Influences on County-Level Differences in COVID-19 Incidence During the Second Wave in Germany
Jasmin A. Gossmann, Dr rer nat,* IQVIA Commercial GmbH & Co OHG, Munich, Germany; Christina Meier, PhD,* IQVIA, Madrid, Spain; Roger-Axel Greiner, Dr rer nat, IQVIA Commercial GmbH & Co OHG, Munich, Germany; Johanna Otto, MD, IQVIA, Madrid, Spain; Evgeniya Shlaen, MSc; Ariane Batscheider, Dr oec publ, IQVIA Commercial GmbH & Co OHG, Munich, Germany
*Authors contributed equally to publication.
Introduction
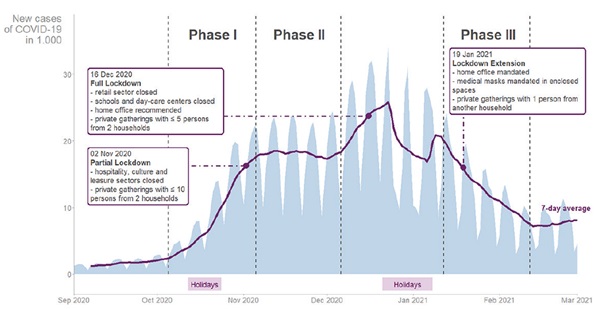
In the fall of 2020, Germany entered a severe second wave of COVID-19, recording 4 to 5 times more cases and fatalities per day than during the first wave of the pandemic, with 2,028,851 cases and 55,642 COVID-19–related fatalities between October 5, 2020 and February 12, 2021.1 The second wave can be divided into 3 distinct phases of rising, stagnant, and falling infection rates (Figure 1).
Figure 1: Number of new daily COVID-19 cases in Germany between September 1, 2020 and March 1, 2021.

Phase I (October 5 to November 5, 2020) corresponded to a rapid rise in daily new cases (Figure 1), following a peak vacation period during federal school holidays in all counties in Germany.2 Only limited COVID-19–related governmental restrictions were in place during most of phase I.3
Phase II (November 6 to December 6, 2020) showed a steady high level of transmissions (Figure 1). Starting on November 2, 2020, the German government imposed a partial lockdown, closing the hospitality and culture sector and limiting social contacts to 2 households. Schools and businesses remained open.3
The period from December 7, 2020 to January 1, 2021 was excluded from our analysis due to high fluctuations in incidence rates. Another rapid increase in cases during the first half of December led to the declaration of a full national lockdown commencing December 16, 2020.3 On December 24th, the first case of the Delta variant was confirmed. Shortly after, the vaccination program began on December 27th, albeit initially limited to caregivers, those aged over 80 years, and other vulnerable persons.
Phase III (January 12 to February 12, 2021) showed a slow but continuous decline in daily new COVID-19 cases (Figure 1). On January 14th, one million (1.2%) German inhabitants had received their first dose of a COVID-19 vaccine. The full national lockdown was prolonged until mid-February, with a newly introduced mandate for medical or higher-grade masks in all closed public spaces3 and for home offices. Schools and day care centers were closed.2,4
We analyzed the substantial differences of rising, stagnant, and falling COVID-19 incidence rates across Germany during phases I to III in the context of varying socioeconomic factors. Other studies found socioeconomic factors to play a role in the speed and extent of transmissions within a community.5-7 There is considerable heterogeneity between German counties in socioeconomic factors, which allowed us to infer likely drivers of COVID-19 transmissions even in the absence of information on individual patients. The current study assumed common underlying socioeconomic factors influencing transmission dynamics for all 401 counties of Germany.
Methods and Results
We investigated whether selected socioeconomic factors could predict COVID-19 incidence at county level.
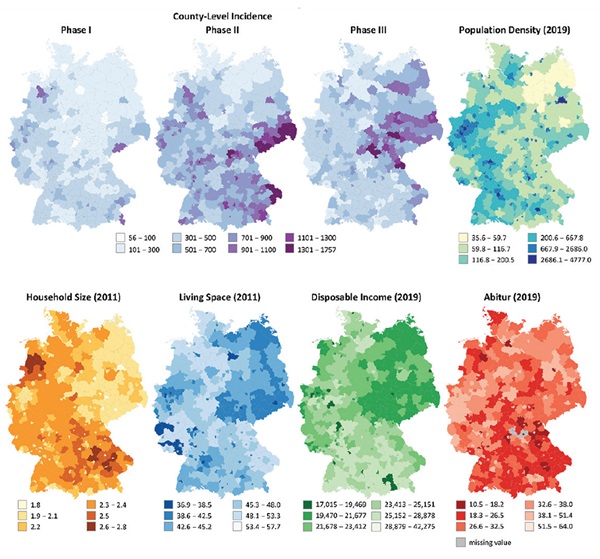
Variable selection was limited by the availability of current county-level data (see Table 1 for summary statistics of included variables). Data were retrieved from the open-access statistics portal “Regionalatlas Deutschland.”8 Selected variables were population density as inhabitants/km2 (henceforth referred to as “PopDens”, data from December 31, 2019), average household size as individuals/household (“HHSize”, May 9, 2011), average living space per building as m2/inhabitant (“LivSpace”, May 9, 2011), average disposable income as EUR/inhabitant (“income”, December 31, 2019), and the percentage of inhabitants with a university-entrance degree (“Abitur,” December 31, 2019). The county-level distribution of each variable was plotted to heat maps (Figure 2).
Table 1: Descriptive summary statistics for the included socioeconomic variables and standardized COVID-19 incidence during the 3 phases of interest.

COVID-19 incidence rates were retrieved from the Robert Koch Institute’s COVID-19 data hub, based on daily new cases reported by health institutions in Germany’s 401 counties.9 We extracted data corresponding to the predefined phases I to III and standardized to cases per 100,000 inhabitants by dividing the reported absolute number of a county’s daily new cases by its population size as of December 31, 2019, multiplied by 100,000 (“cases/100k”). Finally, daily new cases/100k were summed per phase and per county and plotted to heat maps (Figure 2).
Figure 2: County-level distribution of COVID-19 incidence in phases I, II, and III, and of the 5 included socioeconomic variables.

For each phase, we computed a robust linear regression model in R (“lmRob” function of the package “robust”) with PopDens, HHSize, LivSpace, income, and Abitur as predictor variables for cases/100k (Table 2).
Table 2: Robust regression of COVID-19 incidence in phase I, phase II, and phase III.

In our analysis, socioeconomic regional differences significantly predicted COVID-19 incidences during the 3 phases. However, in contrast to phases I and II, the predictive power of our model for phase III was weak (Table 2).
LivSpace showed the most consistent correlation with COVID-19 incidence for phases I to III. Throughout all 3 phases, counties with less LivSpace showed consistently more cases/100k than counties with more LivSpace.
PopDens, HHSize, and income showed a significant positive correlation with cases/100k during phases I and II, but a negative correlation during phase III. During phases I and II, more cases/100k were reported in counties with greater PopDens, greater HHSize, and, interestingly, higher income. However, during phase III, this relationship reversed. During phase III, the higher a county’s PopDens, HHSize, and income, the fewer cases/100k it reported
(Table 2).
Abitur was not a reliable predictor of COVID-19 incidence.
Discussion
Social disparities were considered in other studies as one of the leading factors influencing COVID-19 infections, especially in periods of rising incidences.7 Workers with frequent face-to-face contact with potentially infected individuals or those in cramped workplaces might be most likely at risk of contracting COVID-19. Particularly affected might be workers in occupations with low academic requirements and low pay, such as those considered essential services (cleaning, public transport, etc) and those relying on temporary work with limited possibility to take leave.7
Although our assumption was that, on an individual level, higher income and education would correspond to greater work flexibility and more compliant behavior and thus a decreased risk of infection, on a county level, we did not see such a connection. Higher income, used as one indicator for social disparities across German counties, was associated with higher COVID-19 incidence when cases were rising or stagnant during phases I and II. The reasons for this are unclear as relevant data on behavior are lacking.
The percentage of inhabitants with Abitur showed a weaker and inconsistent connection to a county’s incidence rates. We conclude that Abitur has a weak connection to risk-relevant behavior or variables such as LivSpace or income. In Germany, inhabitants with Abitur have only a marginally higher amount of average lifetime earnings compared to inhabitants with vocational training.10
LivSpace, HHSize, and PopDens are indicator variables for individual space. The spatial factor in addition to exposure time is a key determinant for COVID-19 infection risk. These space-related variables reflect the general potential of inhabitants within a county to socially isolate and decrease their individual exposure risk. Thus, we expected a consistently strong correlation with incidence rates for these variables during all 3 phases.
"Social disparities, here measured through differences in income and education, seemed to play a subordinate role in determining areas of high incidence during periods with limited governmental intervention."
While this was true, a strong correlation was observed only for phases I and II. Hence, sufficient individual space was a crucial factor for lower COVID-19 transmissions within a population in times of accelerated increase or steady high level of transmissions and with limited governmental restrictions (phases I/II). Interestingly, our chosen variables lost their predictive value in times of strict lockdown conditions (phase III). Although the correlations modeled for phase III allow no meaningful interpretation, it is intriguing to contemplate potential causes for the correlation loss.
Why did our selected variables lose influence in phase III? The introduction of nonpharmaceutical interventions—particularly the full national lockdown—in phase III likely disrupted the influence that was observed in the previous phases. The closing of schools and a work-from-home mandate reduced contacts outside one’s household to a minimum and affected all households. Of our indicator variables for individual space, HHSize may have lost impact as multiplicator after virus introduction into the household because of the restrictions on interhousehold encounters; PopDens may have lost impact due to reduced contact possibilities under lockdown restrictions (work-from-home, closed schools, etc). Of all the spatial variables, only LivSpace seems to have maintained a measurable effect.
What driving factors could be influencing incidence in phase III? Instead of county-level factors, COVID-19 incidence in phase III seems rather determined on an individual level. Determinants may have been individual possibilities to reduce nonhousehold contacts and individual levels of compliance. One’s occupation and potential to work from home likely had a major influence on infection risk but cannot easily be measured as the occupations classified as essential (and thus exempt from work-from-home mandates) covered a wide range independent of income or other social factors. Individual compliance with lockdown measures is another important contributing factor but cannot be measured through county-level variables. A follow-up investigation of the driving factors in phase III would give more insight into the socioeconomic dynamics in times of declining COVID-19 cases under strict lockdown conditions.
In conclusion, socioeconomic factors played an important role in the ease of transmissions within a population during the second wave of infections of the COVID-19 pandemic in Germany. During periods of exponentially rising or consistently high incidence rates with limited governmental intervention, providing sufficient individual space within an area, here measured by LivSpace, HHSize, and PopDens, was crucial in facilitating low daily incidence rates. Social disparities, here measured through differences in income and education, seemed to play a subordinate role in determining areas of high incidence during periods with limited governmental intervention.
Our analyses were limited to a small selection of variables of interest potentially affected by multicollinearity, influencing the interpretations that could be drawn in this occasion. Access to a more comprehensive data set, including factors such as age, family status, occupation, religious or political convictions, disparities between East and West Germany, or the influence of neighboring countries in border areas could provide further insights into the complex interplay of socioeconomic factors and COVID-19 incidence.
References
1. Worldometers.info. COVID-19 Coronavirus Pandemic: Germany. Published April 6, 2022. Accessed April 6, 2022. https://www.worldometers.info/coronavirus/country/germany/
2. Schilling J, Buda S, Fischer M, et al. Retrospektive Phaseneinteilung der COVID-19-Pandemie in Deutschland bis Februar 2021. [Retrospective phasing of the COVID-19 pandemic in Germany until February 2021.] Epidemiologisches Bulletin. 2021;15:8-17. doi:10.25646/8149
3. Bundesministerium für Gesundheit. Coronavirus-Pandemie (SARS-CoV-2): Chronik bisheriger Maßnahmen und Ereignisse. [Federal Ministry of Health.Coronavirus pandemic (SARS-CoV-2): Chronicle of measures and events.] Published February 21, 2022. Accessed February 23, 2022. https://www.bundesgesundheitsministerium.de/coronavirus/chronik-coronavirus.html
4. Schilling J, Tolksdorf K, Marquis A, et al. Die verschiedenen Phasen der COVID-19-Pandemie in Deutschland: Eine deskriptive Analyse von Januar 2020 bis Februar 2021. [The different periods of COVID-19 in Germany: a descriptive analysis from January 2020 to February 2021.] Bundesgesundheitsblatt. 2021;64(9):1093-1106. doi:10.1007/s00103-021-03394-x
5. Fraunhofer-Institute for Intelligent Analysis and Information Systems. Unterstützung der Gesundheitsämter in der Corona-Response durch Analyse, Simulation und Visualisierung. [Support for the health authorities in the corona-response through analysis, simulation, and visualisation.] Accessed April 5, 2022. https://www.iais.fraunhofer.de/de/geschaeftsfelder/healthcare-analytics/fraunhofer-projekte-corasiv-und-coperimoplus.html
6. Wachtler B, Michalski N, Nowossadeck E, et al. Sozioökonomische Ungleichheit und COVID-19 – Eine Übersicht über den internationalen Forschungsstand. [Socioeconomic inequality and COVID-19: An overview of the international international state of research.] J Health Monit. 2020;5(S7):3-18. doi:10.25646/7058
7. Doblhammer G, Kreft D, Reinke C. Regional characteristics of the second wave of SARS-CoV-2 infections and COVID-19 deaths in Germany. Int J Environ Res Public Health. 2021;18(20). doi:10.3390/ijerph182010663
8. Statistische Ämter des Bundes und der Länder. [Statistical Offices of the Federation and the Federal States. Regional Atlas Germany.] Regionalatlas Deutschland. Accessed May 23, 2021. https://regionalatlas.statistikportal.de/
9. Robert Koch Institute. COVID-19 Datenhub. Accessed May 23, 2021. https://npgeo-corona-npgeo de.hub.arcgis.com/datasets/dd4580c810204019a7b8eb3e0b329dd6_0//
10. Statista. Höhe der durchschnittlichen Lebensverdienste in Deutschland nach Bildungsabschluss: Source: Institut für Arbeitsmarkt- und Berufsforschung. [Level of average lifetime income in Germany by level of education: Institute for Employment Research.] Published February 8, 2014. Accessed April 27, 2022. https://de.statista.com/statistik/daten/studie/288922/umfrage/durchschnittliche-lebensverdienste-in-deutschland-nach-bildungsabschluss/

